Prototype Dip Well Sensors Installed
A week after the first dip-wells were sunk the new prototype ground water monitoring sensors were installed by a team of scientists from Liverpool John Moores University (JMU).
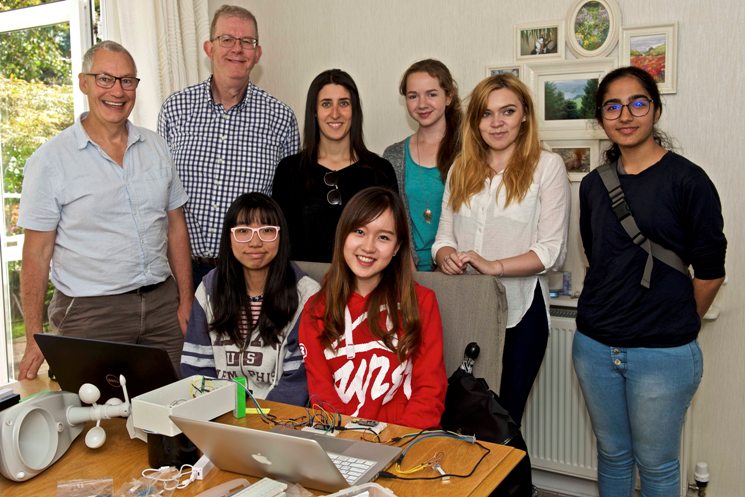
JMU team arrive at Bob McCann's (second from left) house to install sensor equipment.
The group contaned a mix of scientific disciplines including, Climate Scientists, Geologists, Soil Scientists, Programmers and Engineers working together to gain a better understanding about what is happening beneath our feet!
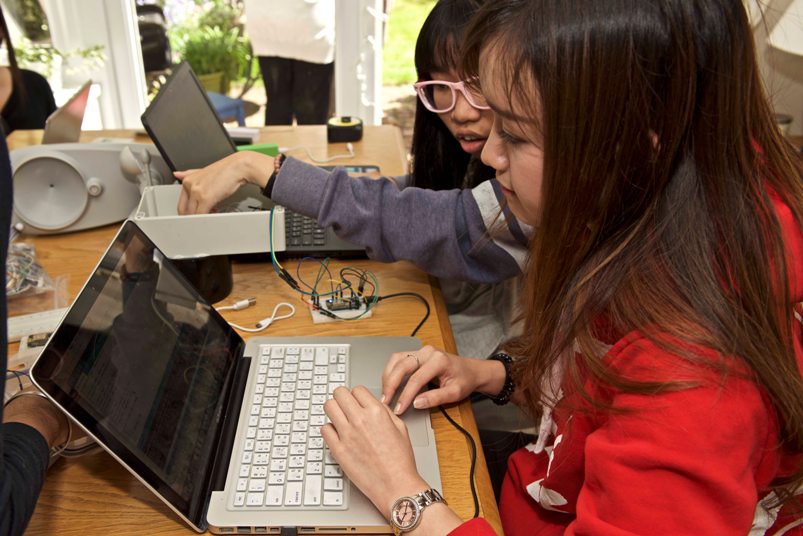
Final testing of the electronic telemetry before installation.
Final checks were carried out to make sure the wireless connection to the sensor was successful and data was being sent to the home WiFi router. The long weighted tube that monitors the height of the ground water was suspended from the electronics module and the whole assembly lowered into place.
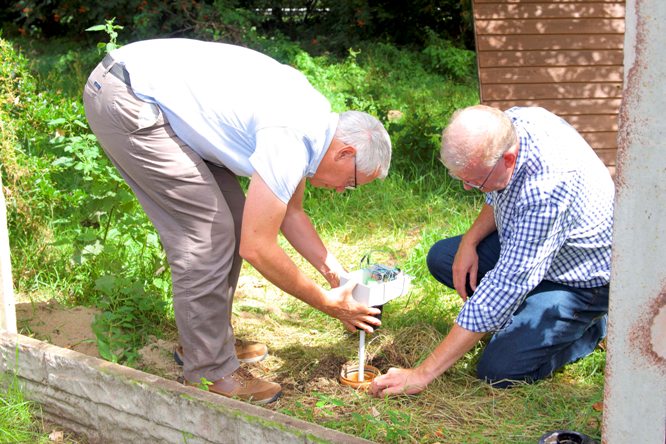
Sensor tube lowered carefully down the well.
Once the electronics were in place, and the computer server at JMU started recieving data, Programmers produced computer code to take the raw data and display the readings on a Google Map showing the exact latitiude and logitude of the dip well.
Soon after the electronics were installed useful data was obtained from the dip wells as heavy rain started to fall that afternoon. After a successful 24 hour trial the prototypes were removed and the information collected is now being used to create a more robust model which will be installed over the next few weeks.
So How Does It Work?
The sensors work on a principle discovered in 250BC by Archimedes. Those of you who can remember back to your school days or are lucky enough to have a GCSE Physicist at home will know that Archimedes said "Any object, wholly or partially immersed in a stationary fluid, is buoyed up by a force equal to the weight of the fluid displaced by the object".
Everyone will have experienced this force when going to the swimming baths. As you walk into the pool the higher the water rises up your body the lighter you feel. There is a force pushing you up which increases the more water your body displaces. As most humans float in water, eventually as more of the water is displaced by your body the buoyancy force pushing you up is equal to the force pushing down and you float!.
To illustrate how this is applied to our ground water sensor I conducted a little experiment you may wish to repeat at home. I used a small concrete walling block (a brick would do but not one recessed on the top), luggage scales, a ruler, some string, scissors, a pencil, a bucket, a broom handle (brush still attached), two plastic patio chairs and some paper to record the results!
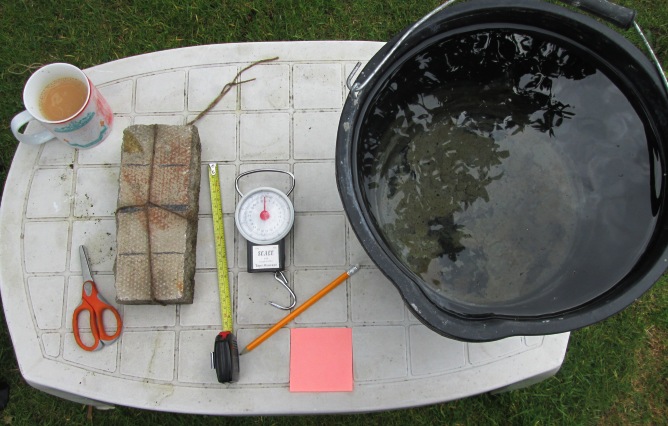
Aparatus for the experiment mug of tea optional!
I measured the length of the concrete walling block, 22cm in all and maked off points along its length at 5.5cm, 11cm and 16.5 cm, or 25%, 50% and 75% of its length.
I hung my luggage scales from my broom handle supended between two patio chairs, over an empty bucket. I tied the concrete block to the scales so it hung vertically inside the bucket without touching the bottom, the top of the block just lower than the rim of the bucket.
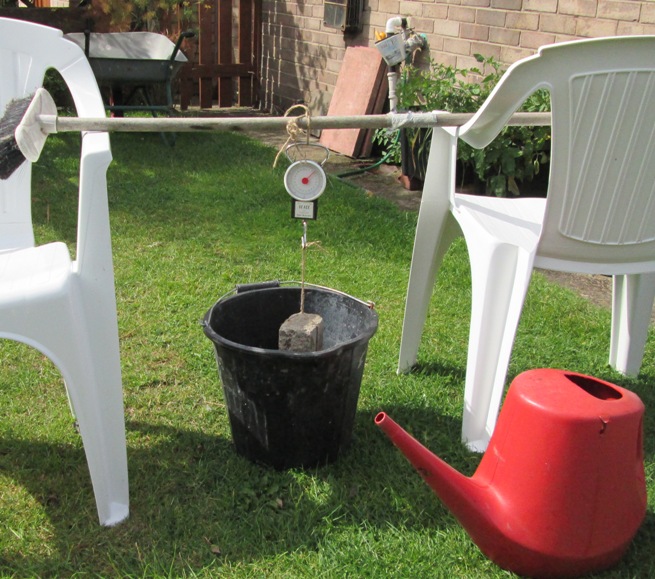
Block suspended inside bucket not touching the bottom.
I recorded the weight of the concrete block suspended in the empty bucket it weighed 2687g. I began to fill the bucket and took a reading of the weight of the block as the water reached 5.5cm 2375g, 11cm 2120g, 16.5cm 1875g and the block fully immersed 1560g. When plotted this produced a negative slope linear graph.
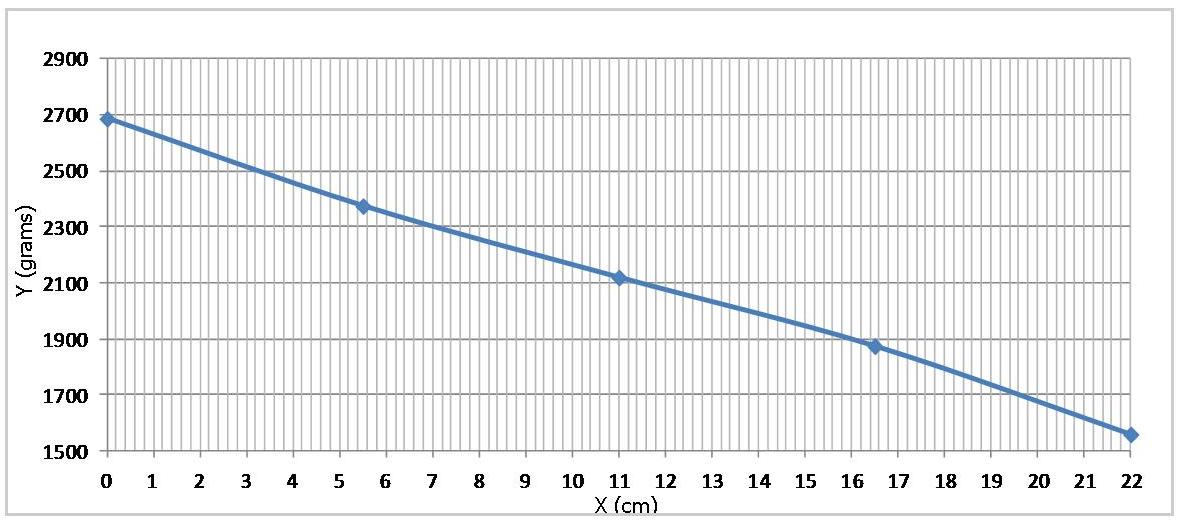
If my concrete block was a bit less knobbly, my scales were a little bit more sensitive and I had recorded a few more data points I could smooth out some of the bumps on my line. However even as it is I can use this graph to get a reasonably good indication of how far up my block the water has reached simply by knowing its weight. For instance if I know my block weighs 2300g using the graph above the water has reached about 7cm up my block.
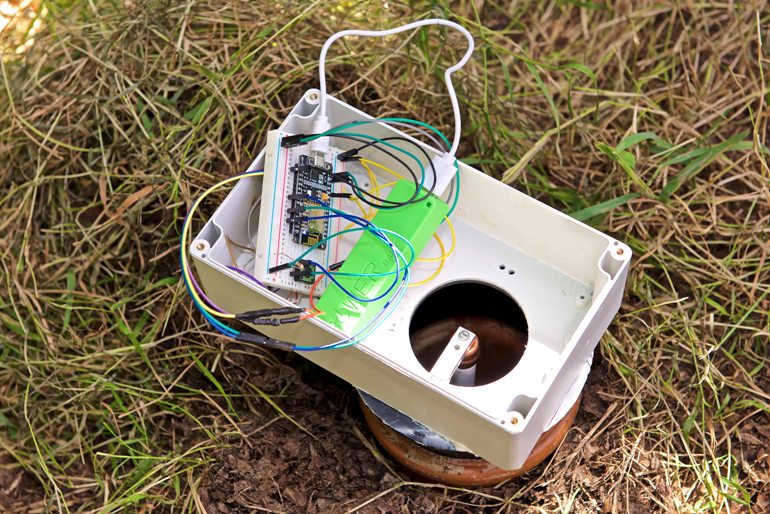
Inside the prototype well head sensor.
So how does this apply to the box of tricks that sits on the well head? You can just see above the white plastic tube decending into the well suspended from a small metal bracket. The tube is filled with sand and capped at both ends, it acts like the concrete block in our bucket experiment. The metal bracket is actually a load cell which can be found in your kitchen scales at home. As the water rises and falls in the well and more or less of the suspended weight (sand filled plastic tube) becomes emersed or exposed the weight on the end of the load cell changes (similar to the luggage scales in our bucket experiment). This information is sent to the broadband router in Bob's house via a WiFi circuit in the box.
The final step of converting the weight of our sand filled tube into height of water in the well is done in the computer by a mathmatical formular which can be obtained from the graph in our bucket experiment!
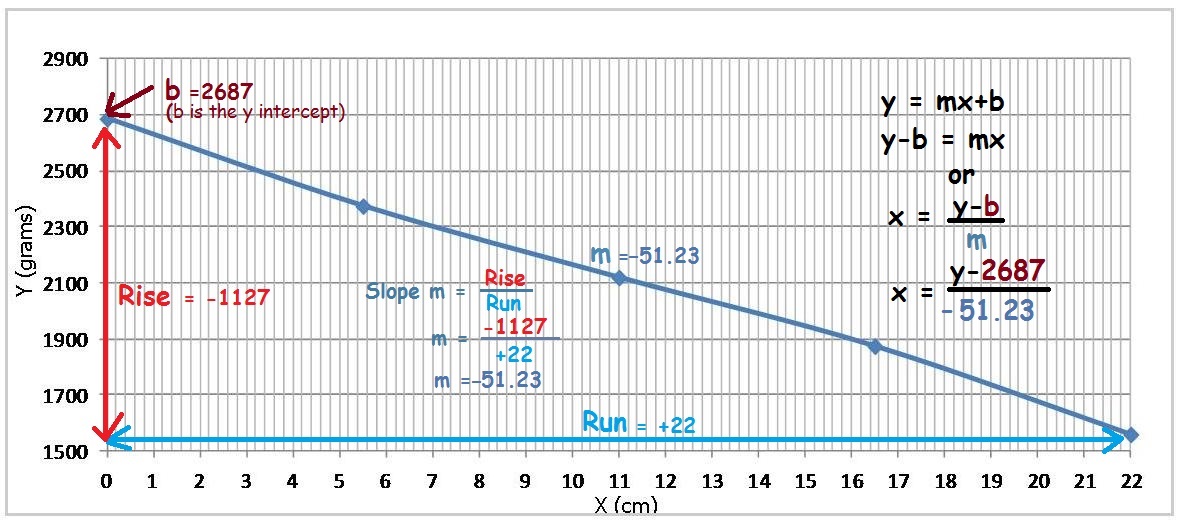
The slope (m) and y intercept (b) can be substituted into the formula that describes our graph.
Although the slope provided by our experiment will be different in gradient to the one produced by JMU's plastic sand filled tubes, the same formula is used with different values for b and m. Even if the maths here doesn't float your boat, consider what would happen if we increased the length of our concrete block, or indeed the sand filled tubes in our dip wells. If I seemlessly glued another identical concrete block to the bottom of the current one, now I would have a block twice as heavy and twice the length, the gradient of my slope (the value of m Rise divided by Run) would be the same. I could keep adding more blocks and the slope or value of m wouldn't alter. So now all I need to know is the starting weight of my extended concrete block(b in the equation above) and I can use any length of block in my bucket and be able to know just how far the water has reached up the block, or to put it another way just how much of the block is submerged.
This is essential because the depth of the ground water varies considerably even within Formby, however if I use the same sand filled plastic pipe, it can be cut to any length that suits the circumstances, and as long as I know its starting weight, I can use it accurately predict how high the water is in the dip well.
This method of automating the measuring of ground water is inexpensive and easily replicated throughout the globe. However were Formby Floodwatch is really fortunate is having David and his team to interpret the data that these wells will produce, thereby gaining a better undersanding of what's going on beneath our feet.